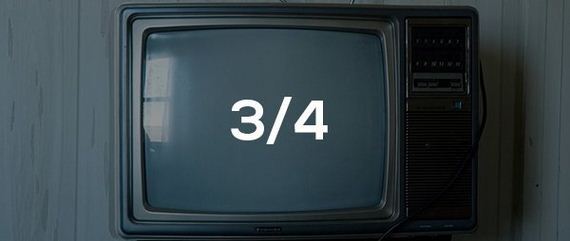
3/4 of the human population in 2002 owned a tv set.
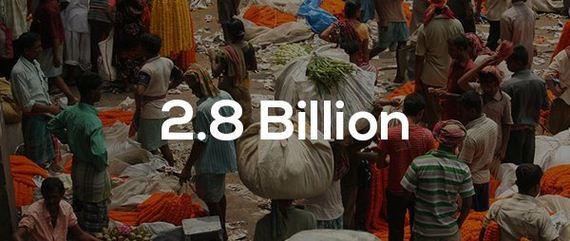
The estimated growth of the human population by 2050.

The amount of people in India and China who are part of “the consumer class”.
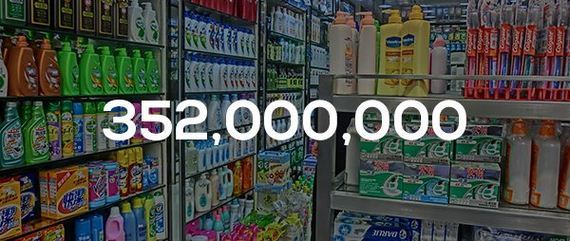
The amount of the European population that belongs to the consumer class.

The amount of people in the world who live off of less than 2 USD a day.
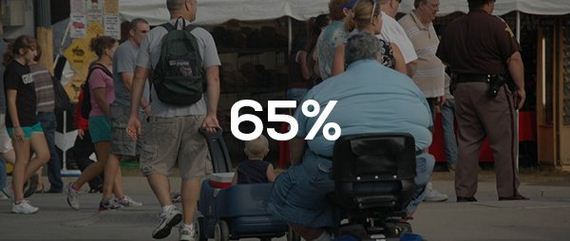
The amount of U.S. adults that are overweight or obese. This leads to hundreds of billions spent on health care.
The amount of the world’s fossil fuels that the U.S. burns.
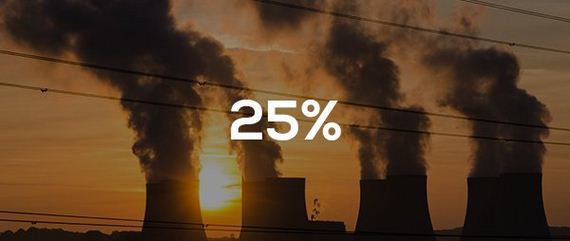
The amount of people who don’t have access to clean drinking water.
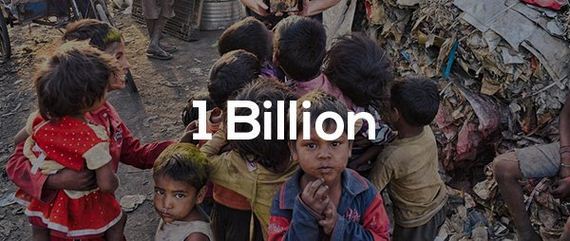
The amount of people who are still undernourished.
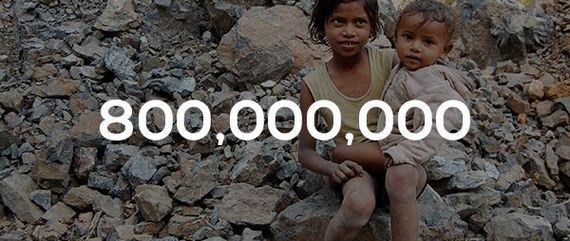
The number of years since the last time the average life expectancy in the U.S. dropped before 2016. In 2016, heart disease caused a drop in average life expectancy.
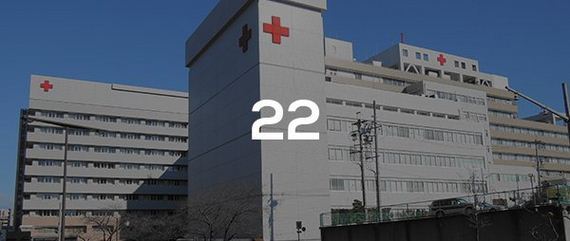
The amount of hectares of usable farmland available per person in the world. The average human uses 2.3.
The amount of people expected to be born in the U.S.A. by 2050.
The amount of dollars spent by private households around the globe in 2000. Approximately 4x more than the amount spent in 1960.
 Barnorama All Fun In The Barn